

Content available at: Indonesia (Indonesian) ไทย (Thai) Tiếng Việt (Vietnamese) Philipino
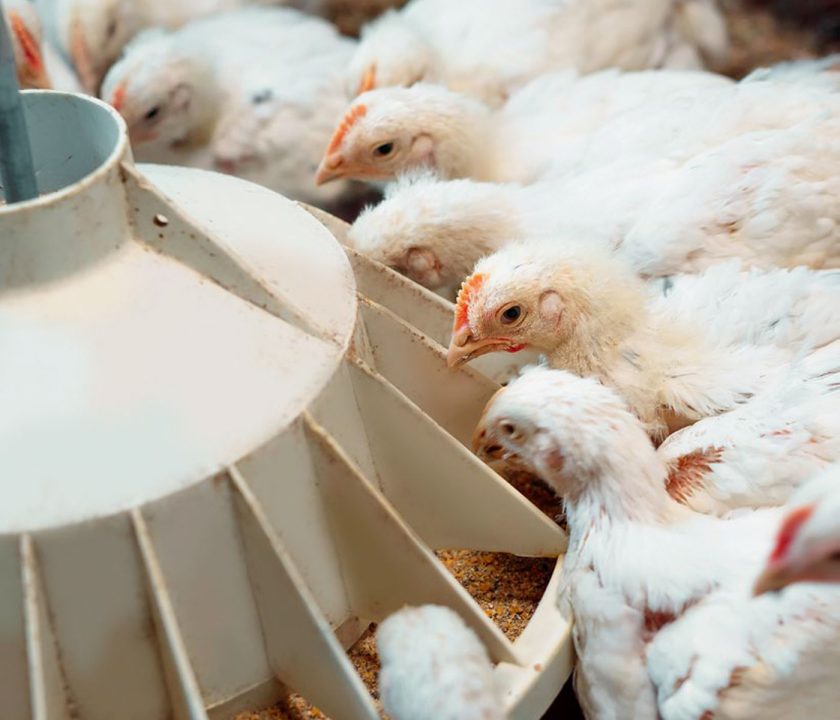
A major goal of poultry nutritionists and feed millers is to ensure that each bird receives the nutrients it needs daily. To do that, the feed must be fairly uniform and contain adequate amounts of each required nutrient.
- The profitability of poultry production is greatly influenced by feed ingredients’ nutrient and energy variability.
- Live flock performance, flock uniformity, and consistency of zootechnical results can be impacted by protein variability in feed ingredients.
Amy Moss and her team (2021) at the University of New England in Australia showed that if you overestimate the amount of nutrients in feedstuffs, you could lose 63% of your profit or $635,100 for every million broilers.
- Small variations in energy, nutrient density, and amino acid digestibility can also impact egg production, egg weight and mass, feed efficiency, energy intake, BW, and egg production profitability.
The variability in feed ingredients is caused by raw ingredients, sampling, and analysis, according to Moss et al. (2021).
FEEDSTUFF VARIABILITY
- The composition of feed ingredients is variable due to genetics, environmental factors, and processing conditions postharvest or during production.
- For plant products, different batches are derived from different cultivars, grown under different climatic and fertilization conditions, and then processed and stored differently.
- Different batches of animal by-products also differ, mainly because of variations in raw materials and how they are processed.
Once feeds are mixed, they must be adequately sampled to ensure that batches contain what they are expected to. Because variation is inherent in different batches with the same ingredient formula, multiple samples of each batch are necessary to estimate the mean.
- When various proportions of feed ingredients are mixed, samples have properties blended from all the incorporated ingredients.
The variances of mixtures are calculated as follows from the variances of the ingredients.
Suppose Xi is a feed ingredient that follows a Normal distribution with the mean μi and variance σ2 i, N (μi,σi2), i = 1, . . . , k, and suppose Xi’s (feed ingredient nutrient composition) are independent. Then:


Follows a Normal distribution with mean μ and variance σ2, N(μ,σ2), where:


How variable are nutrients in a feed?
The Microsoft Excel workbook called “FeedVariation.xlsx” was designed by Dr. Pesti to use these formulas. It is available from the Poultry Hub Australia web page under “Research Resources”.
Figure 1 shows a portion of the “Protein Example” worksheet. The ingredients, with their average protein levels and standard deviations, are from samples collected from Australian producers and compiled in the Australian Feed Ingredient Database (AFiD).
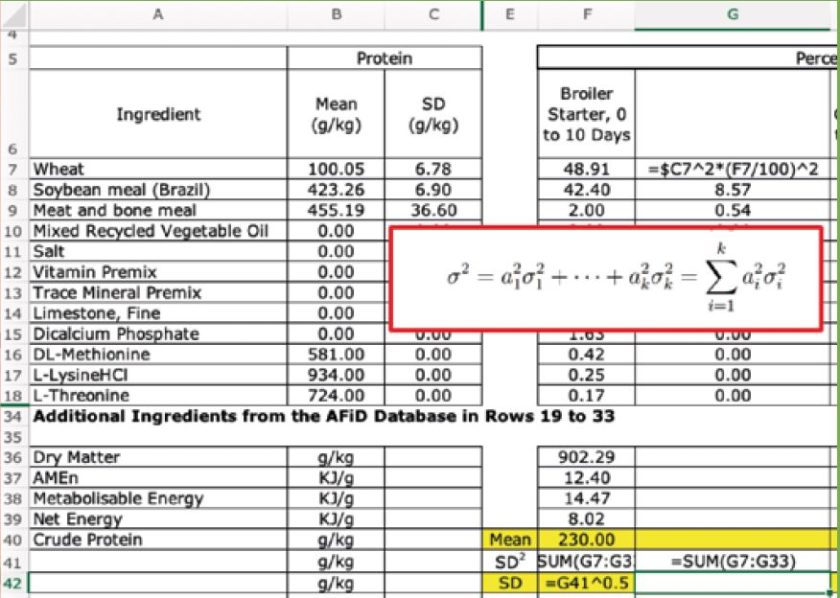

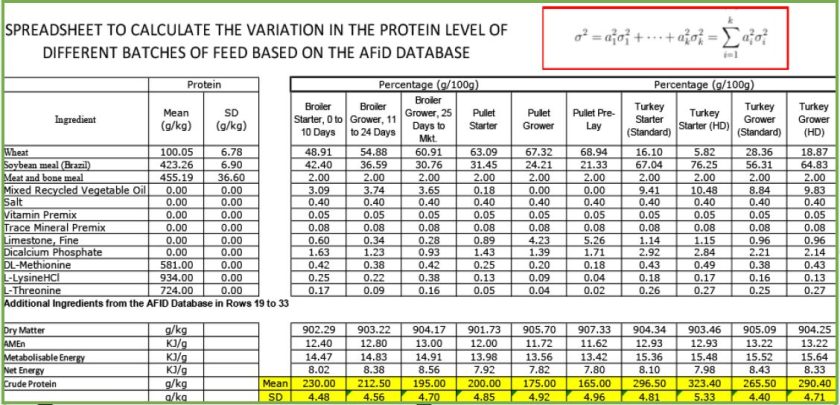
In the right center portion of Figure 2 are some formulas for feeds for different classes of chickens and turkeys, and there are more on the actual worksheet.
- At the bottom of the worksheet are the calculated averages and standard deviations of each feed’s expected crude protein levels, highlighted in yellow.
- You can download the workbook and click on each cell to see how the calculations were consistent with Equation [3] above.

If many batches of Broiler Starter, fed generally from 0 to 10 days, were mixed from random samples of Australian ingredients, the average crude protein levels of the feeds would be expected to be 230 g/kg CP. Half of the batches would be expected to contain more and half less than 230 g/kg CP.


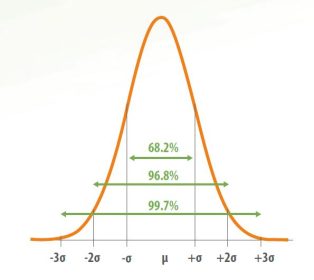
The normal distribution (Figure 3), defined by the mean and standard deviation, could be used to estimate the distribution of batches of feed.
Thirty-four percent of batches of this feed would contain between 230 and 230 – 4.48 = 225.52 g/kg CP; 13.5 % of batches of feed would contain between 225.52 and 225.52-4.48 = 221.04; and 2.5 % of batches of feed would contain less than 221.04 g/kg CP.
Poultry producers often purchase ingredients from the same supplier, so the variation in some ingredients may be less than expected from the AFiD database.
Nonetheless, this analysis points out the importance of monitoring ingredients to decrease variation as much as possible.
- Limiting variation in mixed feeds is essential when the producer is feeding their own birds, but even more important when the producer sells feed, and the customer expects each batch to have a specified minimum amount of each nutrient.
- Using average values may not be acceptable to the customer.

Analytical variability and NIRS
- Monitoring ingredient variation indicates more analysis and more use of the labs.
- However, the analytical variability among laboratories has been as significant, or in some instances even more remarkable, than the variability in nutrient variability attributed to corn or soybean meal sources.
- Consequently, properly sampling feedstuffs and comprehensive and precise analysis of nutrient content ought to gain greater significance.
Energy content, CP, and AA digestibility are rarely determined for distinct batches of feedstuffs in feed mills.
- Energy values are a bigger problem because they are always estimated using prediction equations that depend mainly on the proximate analysis results and may underestimate metabolizable energy (ME).
- There is high variability between apparent ME and apparent ME corrected by nitrogen.
NIRS
For more than thirty years, the feed industry has had an alternative to tracking nutrient composition in feed ingredients. This uses near-infrared reflectance spectroscopy (NIRS), but not everyone agrees with using the data from NIRS. Wet chemistry results are still considered the most reliable in many places.
The NIRS analysis offers several advantages, including:
- Rapid scanning of samples and results provided in minutes.
- A small amount of one sample is necessary to obtain several nutrient analytes, energy content, and digestibility coefficients simultaneously.
- Low cost.
- Highly reproducible results regardless of the geographical location where the sample was collected.
- Minimal or no sample preparation is required.
- Equipment can be placed directly in the feed mill or in-line during feedstuff processing. NIRS can be portable.
- NIRS can be portable.
These factors make NIRS analysis more sustainable than the wet chemistry analysis.


There are two ways to make NIRS calibration curves: direct and indirect.
- The indirect calibration method regresses chemical or physical analysis results with NIRS spectra to estimate proximate analysis values, total AA, starch, and other nutrients and antinutrients.
- In contrast, direct NIRS calibration uses samples of feed and feces obtained from animal experiments. Direct calibrations incorporate in-vivo data concerning the numerous interactions between the feed and the animal that impact final nutrient utilization, AME, AMEn, and AA digestibility.
Numerous research groups have evaluated the precision and accuracy of NIRS calibration models for predicting feedstuff nutritional value, yielding results comparable to those obtained through lab wet chemistry and in-vivo approaches.
CONCLUSION
- It is recommended that the feed industry starts applying the information obtained with diverse NIRS models available in the market to better understand the variability in macronutrients, energy, and starch and fiber components.
- A better understanding and control of feedstuff variability can help us to be more precision in feed formulation and poultry production.