
To read more content about AviNews-América Latina Sep 2015
To read more content about AviNews-América Latina Sep 2015
Contenido disponible en:
Español (Spanish)
Avian Health International, LLC
Assistant Professor for the University of Georgia
One of the most useful and practical tools in the vigilance and diagnosis of poultry diseases is serology. This article summarizes ten fundamental basics which must be considered by the field and lab personnel for a correct, practical and productive use of serology.
Serological tests known as enzyme-linked immunosorbent assay (ELISA) are maybe the most common serological tests, although not the only ones.
The 96-well plate format of ELISA allows for processing of several samples at the same time. Also, at present, there are automated sample handling systems which literally allow for processing of thousands or hundred thousand serum samples. Therefore, ELISA assays represent a fast, convenient, sensitive, specific and economic method.
It is true that there are other types of sensitive and specific assays which are often cheaper. However, it is difficult to compete with the practicality of ELISA assays from several points of view, including quickness, economy, process automation potential (see Figure 1), sensitivity, specificity and volume of samples capable of being processed in a short time.
ELISA assays are used to detect antibodies to several poultry pathogens or important agents for public health, and even water pollutants, ingredients or finished feed, pharmacological waste and mycotoxins
Many poultry health experts and lab staff do not have much time to visit most of chicken or hen farms, breeder farms, hatcher, chicken or turkey processing plant, and to deal with crucial issues such as animal well-being, preventive medicine matters, public health, etc…
Furthermore, they must ensure the bird’s health and minimize material seized at slaughterhouses or the commercial egg decrease in classifying plants, packing plants and egg industrializing companies…
For a serological data base to be useful, the first step is to design a sampling strategy for the company so that the company’s representative samples obtained at strategic ages and in strategic areas and farms allow for the trend identification, at the appropriate time, without the need to make strictly diagnosing effort.
Serology is one of the basic tools for identifying, at the appropriate time, avian health trends

Figure 2. ELISA process automation
The construction of an internal data base, of the company itself, allows for objectively analyzing serological data so that when identifying significant deviations in antibody readings they may be correlated to, for example, the use of a new vaccine, field challenge with certain specific pathogen, hiring of a new vaccination team, etc.
An internal data base allows us to compare serology to the historical data from the company or the region
Never trust pre-established ELISA or serological values exclusively as universal reference, since each region has its particular production system, field challenges, disease prevalence, vaccination plans, legislation from each country or region, etc.
For example, when ELISA antibody titers against infectious bronchitis start to significantly increase without any kind of explanation, this may be due to:
The objective is to detect trends for correcting problems or improve situations
Once a data base for each company is created, then, comparisons may be made of the present serological behavior against the behavior in the same season one year ago, or against other production units from the same company, or against other companies from the same region.
Using, as a reference, any historical data base generated in other regions and under other conditions must be avoided.
For example, what is normal as serology for the Newcastle disease in one area not suffering from enzootic velogenic Newcastle will most likely be very different to the serology observed in areas wherein this disease is enzootic.
A company or region may be used to using recombinant vaccines rather than traditional ones and, therefore, the former will tend to show poor serological activity compared to a company or area using active (live) attenuated viral vaccines.
Therefore, and for many other reasons, companies must always use their own historical data as main reference for identifying trends or changes generated by any variable.
In any case, it is advisable to compare data from each company against data from the region or from other regions since this allows us to ask questions.
For example, lower ELISA titers in a company compared to the rest of the industry may be due to an indefinite number of factors, including the use of inefficient vaccines, an incorrect design or application of vaccination plans, immunodepression problems, etc.
Comparisons with data other than the company’s data must be carried out with caution since they may lead to confusions or bad interpretations.
Making comparisons enables you to find out improvement opportunities in infectious disease prevention


Serological behavior of each company tends to vary at least in part depending on the time of year, especially in cases of very marked seasons.
This is because, generally, there are differences in the frequency of respiratory diseases, being, for example, in winter and the beginning of spring in northern latitudes when there are more problems related to infectious bronchitis and, therefore, there is more serological activity in this time of year.
In winter, the barns are kept closed, there may be ventilation problems and, hence, more respiratory problems and greater serological activity.
The same may happen in areas with a “rainy” and a “dry” season and wherein some variation may exist in the frequency and appearance of diseases or wherein birds react differently in relation to vaccination in each time of year.
In the lab, variables which depend on the laboratory itself may be generated
ELISA tests are based on enzymatic reactions and, therefore, a cold temperature in the lab may generate slightly lower antibody titers compared to laboratories maintaining a higher temperature in the building in which these tests are carried out.
Therefore, it is crucial to always keep room temperature at 21oC if possible, avoiding significant temperature variations.
A cold temperature in the lab may generate slightly lower antibody titers
As stated above, ELISA tests represent a fast, convenient, sensitive, specific and economic method, however, they are NOT always the most adequate tests for every situation.
There are cases in which the hemagglutination inhibition (HI) may provide more valuable information.
For example, if the objective of a company is to recognize trends in the control of infectious bronchitis in its broiler chicken production, ELISA tests will be perfect.
However, if you need to know if any greater serologic activity in chickens is caused by any serotype or variant in particular, then HI tests may contribute, in some cases, to clarify if the seroconversion identified by ELISA is due to some specific strain, for example, strain Arkansas or Massachusetts, Connecticut or Delaware 072.
AVIAN INFLUENZA
In another example, in countries where there is enzootic avian influenza, ELISA tests may be used to evaluate responses to vaccinations or to field challenges, however, many countries prefer using HI since this test is cheaper and may specifically detect antibodies and seroconversion against subtypes H5 or H7 (and others) for example, while ELISA test only detects seroconversion against influenza type A.
INFECTIOUS LARYNGOTRACHEITIS
In a further example, ELISA tests for detecting antibodies to infectious laryngotracheitis (LT) may detect seroconversion, but they DO NOT represent an important or useful predictive value.
Seroconversion against LT only indicates that birds were exposed to active attenuated viral vaccines or to field virus, but antibody levels are not useful to predict the grade of protection since immunity against LT is basically cell type immunity, independently of the specific antibody level.
Also, today, many regions use recombinant vaccines against LT and these vaccines do not generate ELISA-detectable antibodies.
However, in a country where LT does not exist and there is no vaccination against this disease, ELISA test may be used to show seroconversion if LT appears and, in this case, this serological test may represent a diagnosis tool.
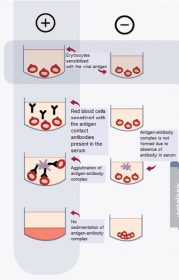
Figure 2. Sequence of HI test
The virus hemagglutination phenomenon was described for the first time by Hirst in 1941.
The viral hemagglutination technique is fast, uses low-cost reactives and it is very easy to be carried out.
It is important to be aware of the capabilities and limitations of each serologic test. NOT all serological tests are capable of providing all the necessary information in order to make decisions and NOT all are adequate in all circumstances

For creating a data base as epidemiological vigilance in broiler chickens, we recommend obtaining blood samples as late as possible in the productive cycle; i.e., at the age of commercialization.
However, if the aim is to demonstrate seroconversion as diagnosis, then, blood samples must be obtained for serology in the acute phase of the disease (at the moment of identifying any problem in the field), and afterwards at the age of commercialization.
This is a very common practice, for example, for identifying seroconversion against specific serotypes or variants of infectious bronchitis.
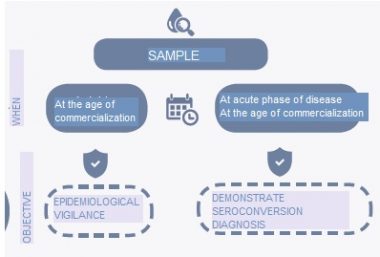
For example, if there is a respiratory problem at the age of 32 days, samples may be immediately taken and afterwards at the age of commercialization, or even some birds may be left in the farm for some days to allow for greater seroconversion.
The first group of samples (32 days) and the one obtained at the commercialization age (43 days, for example) are subjected to ELISA and HI.
At day 32 it is very likely that there are very few antibodies and that with HI tests, there are possibly no detectable differences between seroconversion against several bronchitis virus such as MASS, CONN, ARK o DEO72 for example.
However, if the field problem is caused by MASS, HI test shall detect a greater seroconversion against this virus compared to other infectious bronchitis virus.
Many field professionals are reluctant to accepting this concept (serology in acute and convalescent phases) since a solution for the current problem is sought.
In the poultry industry -thought as scale economy- we must identify problems and solve them for the future production and said identification should not be used to solve a problem in only one chicken batch
Poultry companies must respect and comply with the tests required by their authorities and by their clients or by countries which import poultry products.
Even though most serologic tests are used to prevent and control specific diseases or for diagnosis, some of them must be used in order to comply with official requirements.
When the company shall prefer any specific test for any disease, the required tests must be complied with as well as with the methods imposed by the authorities, even if we wish to continue using other tests of our preference.
No attention should be paid to antibody levels exclusively without having at least any notion of possible local pathogenic strains, variants or serotypes.
The epidemiology of the region should be known in order to optimize sampling strategies and serology interpretation.
Many times it is not easy to be aware of the epidemiological situation of a region and we can only be aware of our own situation.
However, a healthy communication level among companies or field and laboratory professionals without compromising any company may contribute to improving disease control in the industry, so that all companies in the region benefit.
When this is not possible due to the level of competitiveness and professional distrust, at least local diagnosis laboratories may make and important contribution anonymously summarizing the problems in the industry.
QUANTITATIVE RESULT
When we evaluate the average of antibody titers, for example, in a breeder batch after vaccination, we look for high and uniform titers as an indication of a good immune response, faced with a correct vaccination using quality vaccines.
Results which demonstrate high and uniform titers- with a low coefficient of variation indicating a high uniformity- represent a quantitative result
QUALITATIVE RESULT
If this example would refer to the infection of the bursa of Fabricius (Gumboro disease), we would be interested in that the detected serologic response represents seroconversion; not only any Gumboro virus, but also, that it represents a response to multiple virus or variants so that there is a greater diversity of antibodies against different antigens or virus strains.
This is known as qualitative response.
The qualitative response not only measures the antibody level but also its “quality” or diversity
In practice, we do not have many examples of serological tests allowing us to evaluate certain level of diversity or qualitative response, but it is important to know the significance of this concept.
COEFFICIENT OF VARIATION
The coefficient of variation (CV) is a measure of uniformity of antibody levels in a group of samples.
The lower the CV is, the lower the variation in the group of samples; or, in other words, a lower CV gives higher uniformity.
CV CALCULATION
The CV is automatically calculated by the softwares which come with the ELISA kits; however, the statistical calculation of the CV may be done dividing the standard deviation by the median (the average) and multiplying the resulting value by 100, so that we can express this CV in percentage.

