Content available at: Indonesia (Indonesian) Melayu (Malay) ไทย (Thai) Tiếng Việt (Vietnamese) Philipino
Though broilers often appear to be evenly distributed throughout a house, more times than not our eyes are deceiving us and we have uneven bird distribution.
Figures 1 and 2 are of the tunnel fan and tunnel inlet ends of a 50’ X 600’ broiler house with 20-day-old birds.
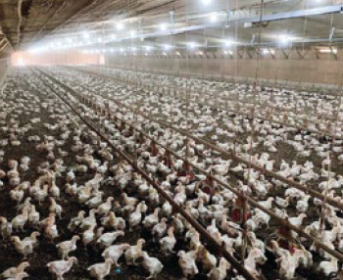
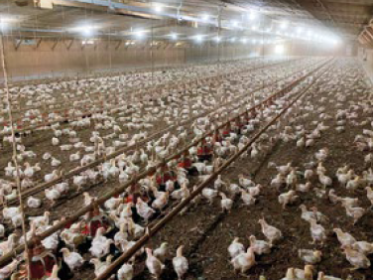
At first glance bird density appears fairly uniform but when examined closely, it becomes apparent that there are more birds near the tunnel doors (far right of Figure 2) than in any other area of the house and we have uneven bird distribution.
The question are, of course, is this “slight” difference in bird density significant? Will it create problems in the future?
This particular house was equipped with two ultrasonic water meters, one for the tunnel inlet end, and one for the tunnel fan end (Figures 3 and 4).
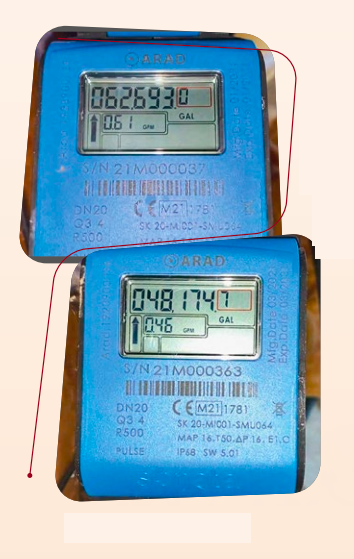
Figure 3. Tunnel inlet end water meter/Figure 4. Cunnel fan end water meter
- In addition to displaying total water usage, these ultrasonic water meters also display water flow rate.
Water meters can be a very useful tool in helping to determine if the birds are evenly spread between the two ends of a house because broiler water usage is a very good indicator of bird density.
- If the water meters indicate that the birds are drinking more water on one end than the other, it is highly likely there are more birds on one end than the other.
In this particular case when the birds were 20 days old, the water meters were indicating that the birds on tunnel inlet end were drinking roughly 20% more water than those on the tunnel fan end (0.61 Vs. 0.46 gals/min).
The twenty percent difference in water usage indicated that there were very likely twenty percent more birds on the tunnel inlet end than the tunnel fan end of the house.
- When the farm manager became aware of this fact he worked on moving birds from the tunnel inlet end to the tunnel fan end but only had limited success doing so.
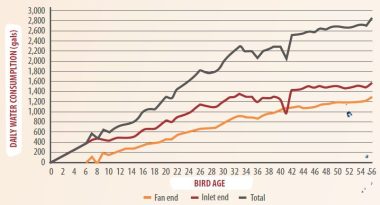
Graphic 1 illustrates daily water usage over the entire flock.
- After the birds were turned out on Day 9 (three migration fences were installed on Day 14) there was roughly a 60% / 40% split in water usage between the tunnel inlet end and the tunnel fan end of the house.
Though the difference in water usage between the two ends of the house tended to decrease slightly toward the end of the flock this was not likely due to the movement of birds between the two ends of the house.
The fact is that since the density was significantly lower on the tunnel fan end the birds had easier access to feed and water than those on the higher density tunnel inlet end which resulted in higher weight gains.
- A fact which became evident when the birds were weighed at 58 days of age (Graphic 2).
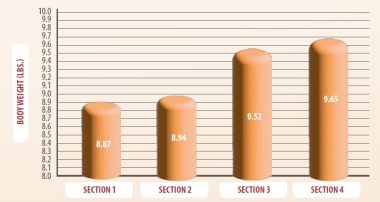
Even though the air temperatures during the August/September flock were generally lower on the tunnel inlet end of the house, the birds on the tunnel inlet end weighed almost 3/4 of a pound less than those on the warmer tunnel fan end.
What made the situation more costly to the grower was there roughly 20% more of the lighter birds on the tunnel inlet end of the house than there were heavier birds on the tunnel fan end of the house.
To help ensure that bird density is as uniform as possible from one end of a house to another and to avoid uneven bird distribution, consider taking the following steps:
- Install at least two water meters. In longer houses (600’+), consider breaking the drinker system into four sections and installing a water meter per section.
- Having four water meters will not only provide a more detailed view of bird density, but also make it easier to recognize possible bird performance problems that may be occurring on in different areas of the house.
- Reception of 1-day birds throughout the hatch during warm climates. During warm weather, when bird migration tends to be most costly, consider full-house brooding.
- Migration fences could be installed at chick placement and the number of chicks placed in each section can be precisely controlled.
- Install migration fences within three to five days of turning birds out into the entire house. The older the birds become, the more difficult it is to move them from one end of the house to the other.
- In houses 500’+, consider installing four or more fences. Placing an extra fence within 50’ of the tunnel fan end wall will help to ensure there are adequate birds in this area of the house to properly trigger feed control pans.
- Placing an extra migration fence. 50’ to 100’ from the tunnel fan end wall can help ensure that bird density can be minimized in this area where air speeds tend to be minimal.
